High-throughput chromosome conformation capture (Hi-C) is an important tool for studying the three-dimensional structure of the genome. By measuring the interaction distance between almost every pair of loci in the genome, Hi-C technology reveals the advanced structure of chromatin, including A/B compartments, topological correlation domains (TADs), enhancer-promoter interactions and bands. These structures are of great significance for understanding gene expression regulation, cell differentiation and disease occurrence.
However, the analysis of Hi-C data is complex and challenging. Firstly, due to the high cost of sequencing, the resolution of Hi-C data is usually low, such as 25kb or 50kb, which limits the analysis of fine genome structure. Secondly, Hi-C data contains a lot of high-frequency details and sharp edges, which may be excessively smoothed by traditional smoothing methods, resulting in inaccurate analysis results. In addition, the processing and analysis of Hi-C data need complex bioinformatics tools and algorithms.
In order to overcome these challenges, a variety of advanced Hi-C data analysis methods have been developed in recent years. For example, DeepHiC improves the resolution of Hi-C data by using a Generative Confrontation Network (GAN), so as to predict the advanced structure of chromatin more accurately. In addition, FreeHiC improves the accuracy and efficacy of different Hi-C analysis methods by simulating and enhancing Hi-C data. These methods not only improve the accuracy of data analysis but also provide new possibilities for the application of Hi-C data.
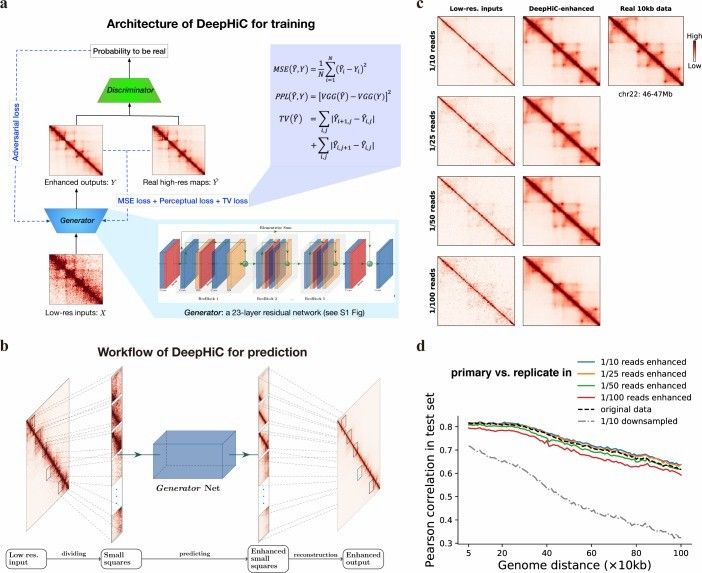 Overview of the DeepHiC (Hong et al., 2020)
Importance of advanced Hi-C data analysis
Improve the resolution: Traditional Hi-C data analysis methods usually rely on mean regression or loss function (such as MSE), which may not accurately capture the high-frequency details of chromatin structure. The resolution of Hi-C data can be significantly improved by generating deep learning techniques such as confrontation network, so as to analyze the advanced structure of chromatin more accurately.
Enhance data quality: The quality of Hi-C data directly affects the accuracy and reliability of analysis results. Through data standardization, artifact removal and error classification, the quality of Hi-C data can be significantly improved. For example, FAN-C software provides powerful data visualization and analysis tools through matrix comparison, PCA analysis and drawing functions.
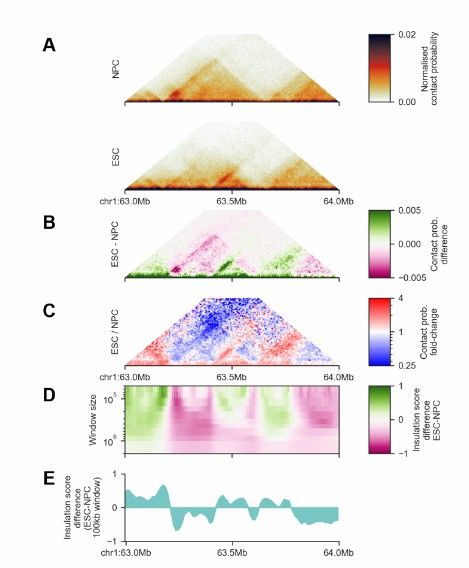
FAN-C Matrix and Feature Comparison (Kai et al., 2020)
Support multi-omics integration: The integration analysis of Hi-C data and other omics data (such as RNA-seq, ChIP-seq, etc.) can reveal the complex relationship between the three-dimensional structure of the genome and gene expression regulation. For example, the difference analysis method based on Hi-C data can detect the difference of chromatin interaction between different cell types or tissues.
Promoting disease research: Hi-C technology is increasingly widely used in disease research. By analyzing Hi-C data in tumor cells, we can reveal the influence of DNA copy number variation (CNV) on Hi-C contact matrix. In addition, high-resolution Hi-C analysis is helpful in understanding the pathogenesis of complex genetic diseases.
Simplify the experimental flow: With the development of technology, the experimental flow of Hi-C is gradually simplified. For example, low-input Hi-C protocols (such as eHiC) can generate high-resolution Hi-C libraries with less than 0.1 million cells. This facilitates the study of small samples or specific cell groups.
Advanced Techniques in Hi-C Data Analysis
In Hi-C data analysis, the application of machine learning and AI, network analysis, graph theory and spatio-temporal analysis are the current research hotspots. The following is a detailed discussion of these areas.
Application of machine learning and AI in Hi-C analysis
Predict model: One of the main applications of machine learning and AI technology in Hi-C data analysis is to construct a prediction model to predict chromatin folding and gene expression regulation. For example, by training a deep learning model, we can use high-resolution Hi-C data and one-dimensional data (such as ChIP-seq peak, sequence similarity and Dam-ID) to predict the impact of sequence variation on genome architecture. These models can improve the understanding of chromatin folding mechanisms and provide support for the prediction of priority mutation sites in the genome.
Data enhancement and simulation: In order to overcome the high cost of Hi-C data generation, researchers developed data enhancement and simulation technology. For example, the FreeHiC tool simulates Hi-C data by nonparametric strategy, thus providing benchmark test and data enhancement for the development of Hi-C data analysis methods. This method helps to improve the generalization ability and robustness of the model.
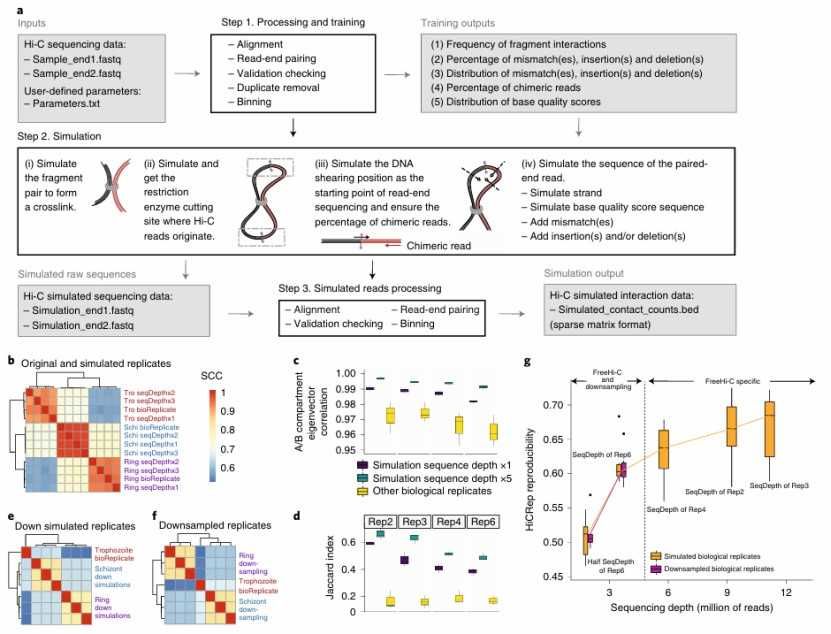 FreeHi-C enables simulating high-fidelity Hi-C data (Zheng et al., 2020)
Feature detection and classification: The computer vision method has also been widely used in Hi-C data analysis. For example, the HCFinder tool can improve the accuracy and repeatability of feature detection by calling tools such as HiCCUPS circularly. In addition, the Hi-C data recognition method based on geometric patterns is also used for single-cell Hi-C analysis and chromatin ring detection.
Application of network analysis and graph theory in Hi-C data
Chromatin interaction network: Hi-C data can be used to construct a chromatin interaction network and reveal the complexity of the three-dimensional structure of the genome. For example, the NuChart tool integrates Hi-C data with genome organization knowledge, constructs a map with the central gene as the neighborhood, and maps multiple omics features. This method is helpful in understanding the biomarkers of different cell types and reveal the key role of the chromatin ring in gene expression regulation.
Graph theory algorithm: Graph theory algorithm also plays an important role in Hi-C data analysis. For example, the TADfit tool identifies TADs by analyzing the replicated Hi-C data. In addition, the NuChart tool uses a graph theory algorithm to visualize and analyze Hi-C data to help users explore chromatin spatial organization.
Genomic interaction in Spatio-temporal Analysis
Dynamic change analysis: Hi-C technology can be used not only to study the static genome structure but also to analyze the dynamic changes of genome interaction. For example, by comparing Hi-C data under different conditions, we can reveal the changes of genome structure in disease states. This analysis is helpful in understanding how genome organization affects cell function and disease progression.
Multiscale analysis: Hi-C technology can be combined with other high-throughput sequencing technologies (such as RNA-seq and ChIP-seq) for multi-scale analysis. For example, by integrating Hi-C data with other omics data, the relationship between chromatin interaction network and gene expression can be revealed. This multi-scale analysis method is helpful to fully understand the function and regulation mechanism of the genome.
Cooltools: It is a collection of computing methods designed to process high-resolution genome folding data. It provides Python API and command line tools, supports modular methods, and is suitable for routine analysis and advanced analysis. Cooltools is closely integrated with Cooler, which is a tool for storing and analyzing Hi-C data and supports the standard split-box Hi-C format.
FAN-C: It is a functional framework for the analysis and visualization of Hi-C data. It supports matrix comparison, principal component analysis (PCA) and various drawing functions. FAN-C also provides interactive visualization tools to support heat maps and other diagnostic charts based on user-defined attributes.
DLO Hi-C Tool: It is an efficient and low-cost tool, which focuses on the digestion-connection of Hi-C data-limited to Hi-C (DLO) analysis. It provides a flexible and multifunctional pipeline, from original sequencing reading processing to standardized contact map, and includes quality control in different stages.
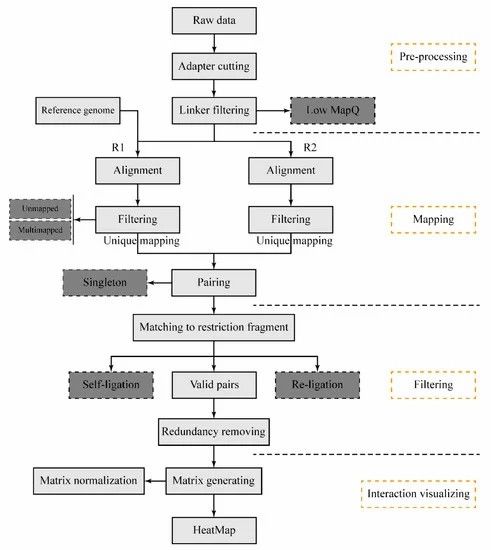 The schematic pipeline for the DLO Hi-C tool (Hong et al., 2020)
NuChart-II: It is an R prototype software based on graphics, which is used to annotate and visualize Hi-C data. It uses gene-centered method to analyze the characteristic knowledge of chromatin tissue spatial genome.
3D Genome Builder (3DGB): 3DGB is a bioinformatics workflow, which is used to simplify the analysis of Hi-C data and the creation of 3D models. Based on Hi-C experimental results, it automatically executes key bioinformatics steps and generates PDB files for further analysis.
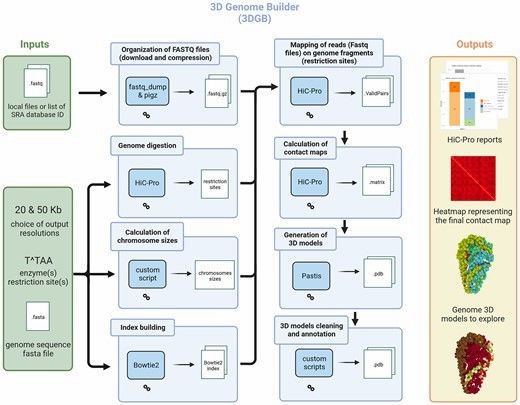 General overview of the 3DGB workflow (Thibault et al., 2023)
Puzzle Hi-C: It is a scaffold software based on Hi-C data, which uses triangle region and dynamic window strategy to reduce the interference caused by long-distance interaction and improve the accuracy of genome assembly.
Genome Architecture Model (GEM): GEM is a computational method, which restores the long-term genomic interaction missing from the original Hi-C data through automatic parameter adjustment and multi-conformation optimization strategy.
Comments